Exception Metrics: Turn Exceptions Into Program Improvements
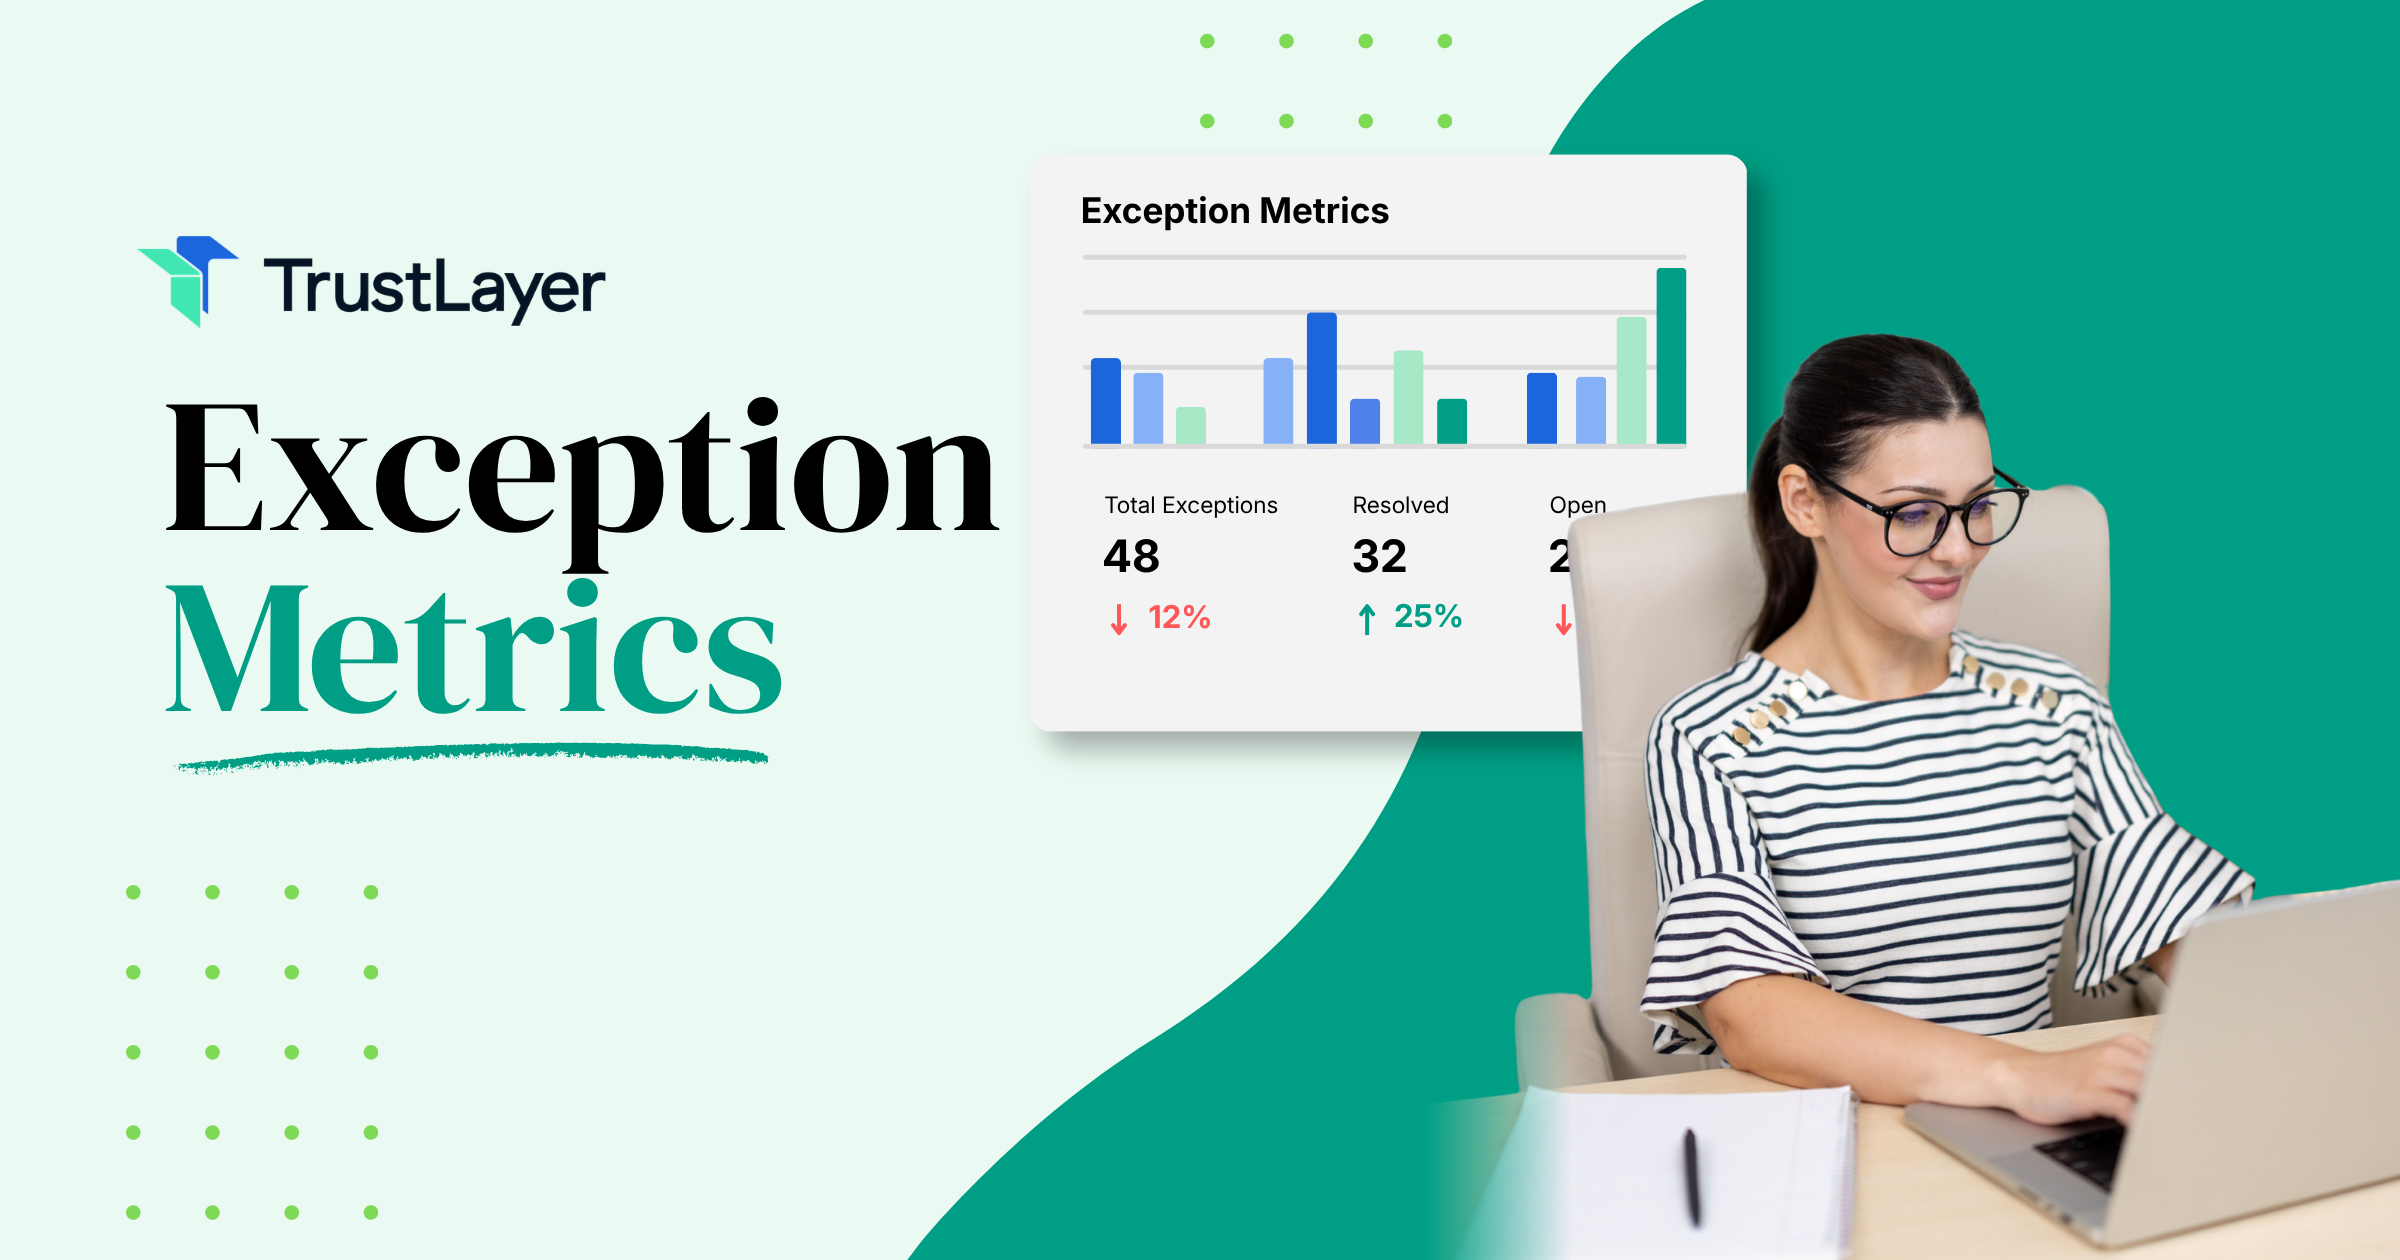
Every organization that manages vendor relationships, subcontractor agreements, or third-party partnerships generates exceptions. A certificate of insurance arrives with the wrong additional insured. A vendor's policy lapses two weeks before a project wraps up. An endorsement is missing entirely. These exceptions pile up in spreadsheets, email threads, and sticky notes, and most risk teams treat them as individual fires to put out. But here's the thing: those exceptions are data. And when you start measuring them systematically, they stop being annoyances and become a roadmap for turning your compliance program from a reactive fire drill into a genuinely proactive operation. Exception metrics can turn exceptions into real program improvements, but only if you know what to track and how to act on what you find.
The difference between a risk management program that looks good on paper and one that actually protects the organization often comes down to whether anyone is paying attention to the patterns hidden in daily exception handling. Most teams aren't. They resolve the issue, move on, and never ask why the same problem keeps showing up quarter after quarter. That cycle is expensive, and it's entirely preventable.
The Strategic Value of Tracking Exception Metrics
Think of your exception data like a car's dashboard warning lights. Individually, a single light might mean nothing serious. But if the same light keeps flashing, or if multiple lights start triggering at once, you'd be foolish to ignore them. Exception metrics serve the same function for your compliance and risk management program: they tell you where the system is stressed, breaking down, or fundamentally misaligned with reality.
The real value isn't in counting exceptions. It's in understanding what those counts reveal about your processes, your vendor relationships, and your insurance requirements. A team that tracks exception frequency, resolution time, and root causes can make targeted improvements that reduce risk exposure and cut administrative overhead simultaneously. A team that doesn't is essentially driving with the dashboard covered up.
Moving from Reactive to Proactive Compliance
Most compliance programs operate in what I'd call "fire drill mode." An audit is coming, so everyone scrambles to verify COIs, chase down missing endorsements, and close open exceptions before the auditor arrives. The audit passes. Everyone exhales. And then the same problems start accumulating again until the next audit triggers another scramble.
Tracking exception metrics breaks this cycle by making compliance a continuous state rather than a periodic performance. When you can see that your exception volume spikes 40% every January because vendor renewals cluster at year-end, you can proactively reach out in November. When you notice that a particular project type consistently generates more insurance requirement mismatches, you can adjust your templates before the next project kicks off. The shift from reactive to proactive isn't about working harder. It's about knowing where to focus your effort based on actual data rather than gut feeling.
Identifying Systemic Risks vs. Isolated Incidents
Not every exception is created equal, and one of the most valuable things metrics reveal is the distinction between one-off mistakes and systemic failures. A single vendor submitting a COI with the wrong policy number is an isolated incident. Twenty vendors across three regions all submitting certificates that fail to meet your umbrella liability threshold is a systemic problem, likely rooted in how you communicate requirements during onboarding.
Without metrics, these two scenarios look the same: just another exception to resolve. With metrics, the pattern becomes obvious. You can see that 60% of your exceptions originate from the same root cause, or that a specific broker consistently provides non-compliant certificates. That kind of visibility lets you fix the source of the problem rather than endlessly treating symptoms.
Key Performance Indicators for Exception Management
Choosing the right KPIs matters. Track too many things and you drown in data. Track too few and you miss critical signals. The three categories below cover what most risk teams need to build a clear picture of their program's health without creating a reporting burden that defeats the purpose.
Exception Frequency and Volume Trends
Start with the basics: how many exceptions are you generating per month, per quarter, per project, and per vendor? Raw volume alone tells you something, but trends tell you more. A steady decline in monthly exceptions after you revamp your onboarding process confirms the change worked. A sudden spike after onboarding a new class of subcontractors tells you your requirements might not fit their typical coverage profiles.
Break the data down by category. Insurance-related exceptions (lapsed policies, insufficient limits, missing endorsements) should be tracked separately from documentation exceptions (expired W-9s, unsigned agreements, incomplete applications). This separation prevents you from treating fundamentally different problems with a one-size-fits-all solution. A useful benchmark: organizations with mature tracking programs typically aim to reduce their exception rate by 15-25% year over year once they begin acting on the data.
Average Time to Resolution (TTR)
How long does it take from the moment an exception is flagged to the moment it's fully resolved? This metric reveals bottlenecks that pure volume numbers can't. If your average TTR is 18 days but your target is 7, you need to understand where the delay lives. Is it in the initial notification to the vendor? In the vendor's response time? In your team's review and approval process?
TTR also exposes risk exposure windows. Every day an exception remains open, your organization is potentially operating with a coverage gap or a non-compliant vendor. If you're carrying 200 open exceptions with an average TTR of three weeks, you're sitting on a significant amount of unresolved risk at any given time. Tracking this number and driving it down directly reduces your exposure.
Root Cause Categorization
This is where metrics become genuinely powerful. Every exception should be tagged with a root cause category: insufficient limits, wrong named insured, lapsed coverage, missing endorsement, incorrect policy type, communication failure, and so on. After a few months of consistent categorization, the data tells a clear story.
If 35% of your exceptions stem from "insufficient general liability limits," that's a signal to revisit whether your requirements are calibrated correctly for the vendor types you're working with, or whether your communication of those requirements is unclear. If "lapsed coverage" dominates, your renewal tracking process needs attention. Root cause data transforms exception handling from a clerical task into a strategic function. It gives risk managers the evidence they need to justify process changes, technology investments, and staffing decisions to leadership.
Transforming Data into Process Improvements
Collecting metrics is only half the equation. The other half, the part that most organizations struggle with, is translating what the data says into concrete changes that reduce exceptions over time. This requires a feedback loop: measure, analyze, change, then measure again to see if the change worked.
Refining Insurance Requirements Based on Data
Here's a scenario I've seen play out repeatedly: a company sets insurance requirements five years ago based on industry standards and a broker's recommendation. Those requirements haven't been reviewed since. Meanwhile, the market has shifted, the company's vendor mix has changed, and certain thresholds no longer match the actual risk profile of the work being performed.
Exception data exposes this misalignment. If 40% of your landscaping vendors can't meet your $5 million umbrella requirement because the market for that trade simply doesn't support it at that price point, you have two choices: keep generating exceptions you'll eventually waive anyway (making the requirement meaningless) or adjust the threshold to reflect reality while adding other risk mitigation measures. The data gives you the confidence to make that call because you can see exactly how many exceptions the requirement generates and how they're being resolved. Requirements that produce a high waiver rate are essentially theater: they look protective on paper but provide no actual risk reduction.
Optimizing Vendor Onboarding Workflows
Onboarding is where most exception seeds are planted. If vendors receive unclear instructions about what coverage they need, or if the process for submitting and verifying COIs is clunky and confusing, exceptions are inevitable. Metrics can pinpoint exactly where onboarding breaks down.
Track exception rates by vendor cohort (grouped by onboarding date) and compare them. If vendors onboarded after you revised your requirements template in Q2 generate 30% fewer exceptions than those onboarded before the revision, you have proof the change worked. If a particular region or project manager's vendors consistently show higher exception rates, the issue might be in how requirements are communicated at the local level. This connects to a governance model where central risk teams set the standards while project-level staff handle day-to-day execution: the data tells you whether that execution is consistent or whether certain teams need additional support or training.
Leveraging Automation for Enhanced Visibility
Manual exception tracking is a bit like trying to monitor traffic patterns by standing at one intersection with a clipboard. You can count what passes in front of you, but you're missing the full picture. Automation doesn't just speed things up: it fundamentally changes what's possible in terms of visibility, accuracy, and response time.
Eliminating Manual Tracking Errors
Spreadsheet-based tracking is fragile. One miskeyed date, one forgotten update, one row accidentally deleted, and your data is compromised. I've talked to risk managers who discovered during audits that their exception logs were missing entire categories of issues because the person maintaining the spreadsheet didn't know to include them.
Automated systems capture exceptions consistently, categorize them according to predefined rules, and maintain an audit trail that spreadsheets simply can't provide. The accuracy improvement alone justifies the transition for most organizations, but the real win is the time recovered. When your team isn't spending hours each week updating and reconciling spreadsheets, they can focus on actually resolving exceptions and implementing the process improvements the data suggests. The administrative burden of manual tracking is one of the main reasons exception metrics programs stall: teams start strong but can't sustain the effort alongside their other responsibilities.
Real-Time Reporting for Stakeholders
Leadership doesn't want to hear about exception metrics once a quarter during a board presentation. They want to know the organization's risk posture right now. Automated dashboards shift the institutional mindset from periodic reporting to continuous awareness, where anyone with the right access can see how many exceptions are open, what the average resolution time looks like, and whether trends are moving in the right direction.
This kind of real-time visibility also changes how conversations with stakeholders happen. Instead of defending your program with anecdotes ("We think we're doing better this year"), you're presenting data ("Our exception volume is down 22% year over year, and average TTR dropped from 14 days to 6"). That's the difference between compliance theater and genuine program effectiveness. It's also the kind of evidence that makes budget conversations for risk management tools and headcount much easier to win.
Strengthening Your Risk Profile with TrustLayer
Exception metrics only deliver value if you can collect, categorize, and act on them consistently. That's where the right technology becomes essential. Fragmented visibility across project teams, site managers, and central risk functions is one of the primary failure modes that hides coverage gaps until a claim forces them into the open.
Building a program that turns exceptions into genuine improvements requires structural foundations: consistent data capture, automated correspondence with vendors, reliable verification of COIs and other compliance documents, and reporting that connects daily operations to strategic risk decisions. If your current process involves chasing vendors by phone and email, manually reviewing certificates, and hoping nothing slips through the cracks, the gap between where you are and where you need to be is significant but entirely closable.
TrustLayer was built specifically for modern risk managers who believe in forward-leaning practices rather than legacy processes. If you're ready to move beyond spreadsheets and fire drills, set up a time to talk with our team and see how automated compliance document management can give your exception metrics program the infrastructure it needs. And while you're at it, explore TrustLayer's other articles on vendor risk management and COI tracking: there's a lot of practical guidance worth your time.
You might also like