Compliance KPI Blueprint: Metrics That Drive Action

Most compliance programs measure the wrong things. They count documents collected, boxes checked, and audits passed, then act surprised when an uninsured subcontractor's accident lands on their own policy. The numbers looked fine right up until they didn't.
The problem isn't a lack of data. Risk teams are drowning in spreadsheets, email threads, and certificate files. The problem is that very little of that data tells anyone what to do next. A metric that doesn't change a decision is just decoration, and decoration is an expensive illusion when a claim is on the line.
This compliance KPI blueprint focuses on metrics that drive action: the handful of measurements that expose real coverage gaps, show how fast your team closes them, and translate risk work into language executives care about. If your current reporting can't tell you which vendors are exposed today, keep reading.
The Evolution of Compliance: From Checklist to Strategic KPI
For years, vendor compliance lived in a filing cabinet. Someone in accounts payable or the project office requested a certificate of insurance, glanced at it, filed it, and moved on. Success meant having a piece of paper on record. Whether that paper reflected actual coverage was a question nobody asked until a loss forced it.
That checklist mindset produced what I'd call compliance theater. Teams scramble before an audit, chase missing documents in a two-week fire drill, then let everything drift for another eleven months. The audit passes, leadership relaxes, and the gaps quietly reopen. It's a cycle that feels productive and protects almost nothing.
The shift toward strategic KPIs starts with a different question. Instead of "Do we have the documents?" the question becomes "Are we protected right now, and how do we know?" That reframing changes everything downstream. It turns compliance from a periodic event into a constant state, something you can check on a Tuesday afternoon without dreading the answer.
Strategic metrics share three traits:
- They point to a specific owner. Every red number should have a name attached.
- They measure outcomes, not activity. Emails sent is activity. Vendors fully covered is an outcome.
- They trigger a defined response. If a metric crosses a threshold, someone knows exactly what to do.
Get those three right and your reporting stops being a backward-looking record. It becomes a tool for steering.
Foundational Metrics for Risk Mitigation
Before you build dashboards or pitch the board, you need a foundation. Two metrics carry most of the weight here, and if they're unreliable, nothing built on top of them matters. Think of them as your program's load-bearing walls.
Vendor Insurance Verification Rates
Your verification rate is the percentage of active vendors whose insurance you've confirmed meets your requirements. Note the word "confirmed." A certificate sitting in an inbox isn't verified. A certificate that's been reviewed against your contract requirements and found compliant is.
Calculate it simply: fully verified active vendors divided by total active vendors. Then break it down further, because the blended number hides a lot. A company might report a healthy overall rate while its highest-risk trades sit far lower. The roofing contractor matters more than the office plant service, and your metric should reflect that.
The most common failure mode here is fragmented visibility. A project manager onboards a subcontractor in the field, the central risk team never hears about it, and that vendor never enters the verification pipeline at all. Data silos between site managers, project teams, and risk management create a fundamental gap: vendors become invisible in your metrics. Track "unregistered vendor discoveries" as a companion KPI, so you know how often work starts before compliance does.
Certificate of Insurance (COI) Accuracy
Collecting a COI and collecting an accurate COI are two very different achievements. Accuracy measures how many certificates on file correctly reflect the coverage your contracts require: right limits, right policy types, additional insured status where needed, current dates, and proper endorsements.
Here's the analogy I come back to. A COI that lists general liability but misses the additional insured endorsement is like a car with an engine but no wheels. Everything looks impressive under the hood, yet it won't take you anywhere when you need it. A certificate with the wrong named insured or an expired umbrella policy is practically worthless when you file a claim.
Track accuracy by error type, not just pass or fail. Common categories include:
- Insufficient limits below contract minimums
- Missing endorsements, especially additional insured and waiver of subrogation
- Expired or soon-to-expire policies
- Name mismatches between the certificate and the contracting entity
Patterns in these errors tell you where to focus. If missing endorsements dominate, your requirement communication to vendors probably needs work.
Operational Efficiency and Response Time Metrics
Knowing a gap exists is only half the job. The other half is how quickly your team acts on it. Operational metrics measure the speed and friction of your compliance process, and many programs quietly bleed time here.
Useful efficiency KPIs include time from vendor onboarding to first verified certificate, average number of follow-up requests per vendor, and the percentage of renewals collected before expiration. That last one deserves special attention. Renewals collected after a policy lapses mean you had a coverage window with no proof, however brief.
This is also where governance structure shows up in the numbers. Programs that route every decision through a central risk team create bottlenecks. Programs that let every site manager set their own standards create chaos. The model that works is centralizing control while decentralizing execution: the risk team owns requirements, thresholds, and oversight, while project leads handle day-to-day follow-up with their own vendors.
Request patterns matter too. For high-risk or regulated work, use a synchronous approach: no verified coverage, no site access, full stop. For routine, low-risk vendors, an asynchronous pattern often makes more sense, letting work proceed while documentation catches up, because a delay there can cause more damage than a short documentation gap. Measure each pattern separately so one doesn't distort the other.
Mean Time to Remediate Non-Compliance
Mean time to remediate (MTTR) tracks the average time between identifying a compliance deficiency and resolving it. If a certificate arrives on Monday with insufficient limits and a corrected one arrives the following Friday, that's four days of remediation.
MTTR is arguably the single most revealing operational KPI because it captures your exposure window. Every day a deficiency stays open is a day you're carrying risk you thought you'd transferred. Track it by vendor tier and deficiency type. Expired policies may resolve quickly, while missing endorsements can drag on because the vendor must contact their broker.
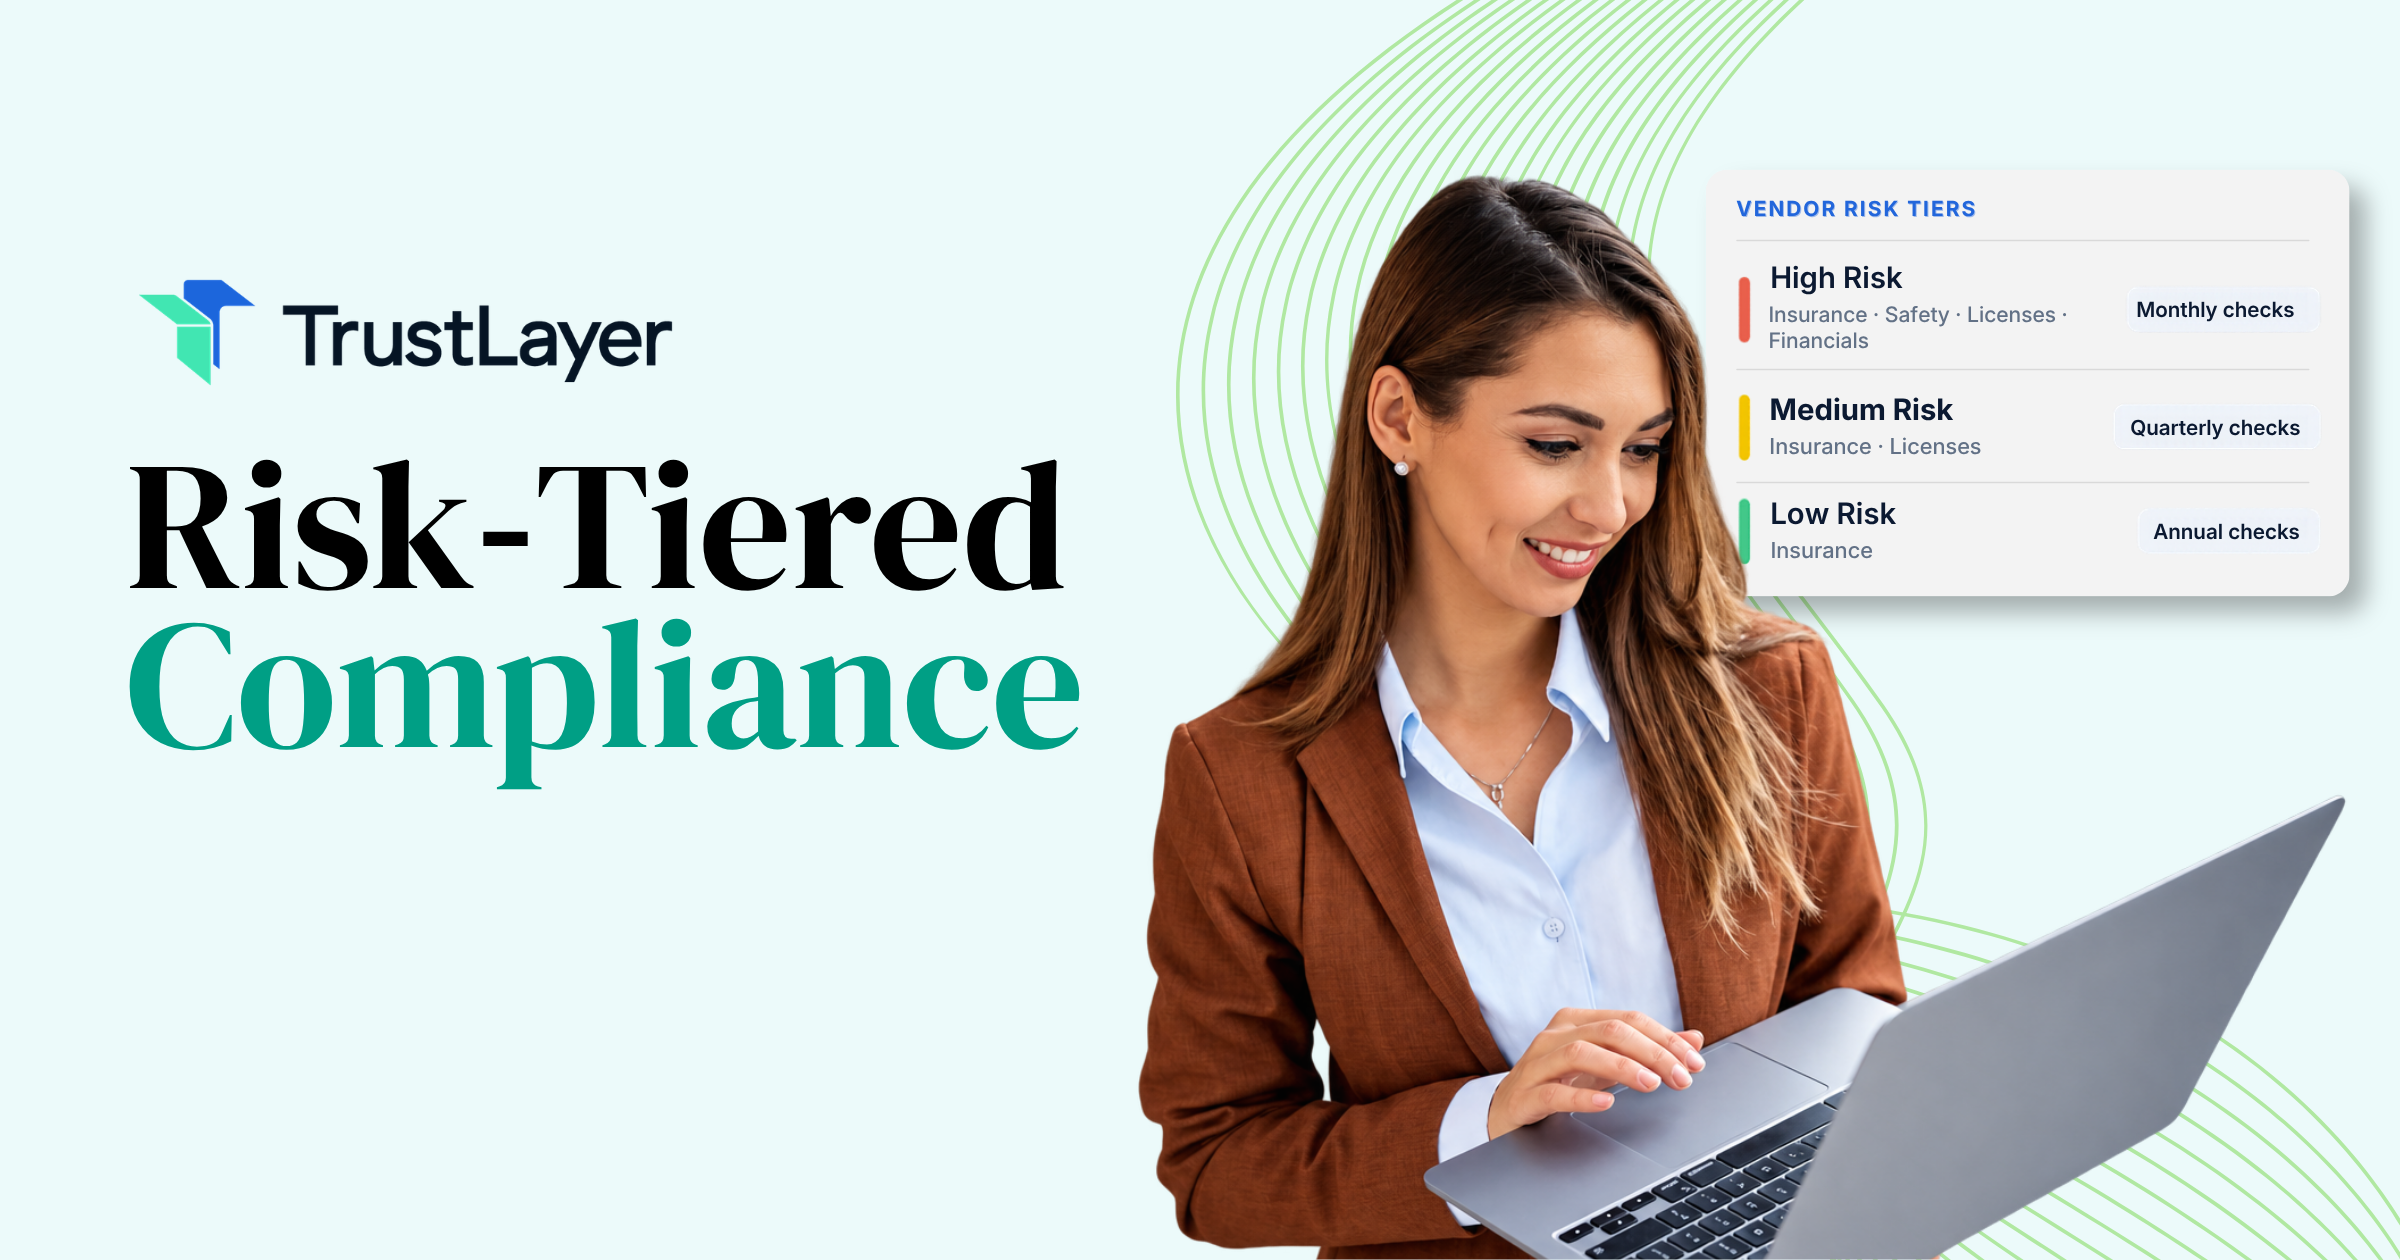
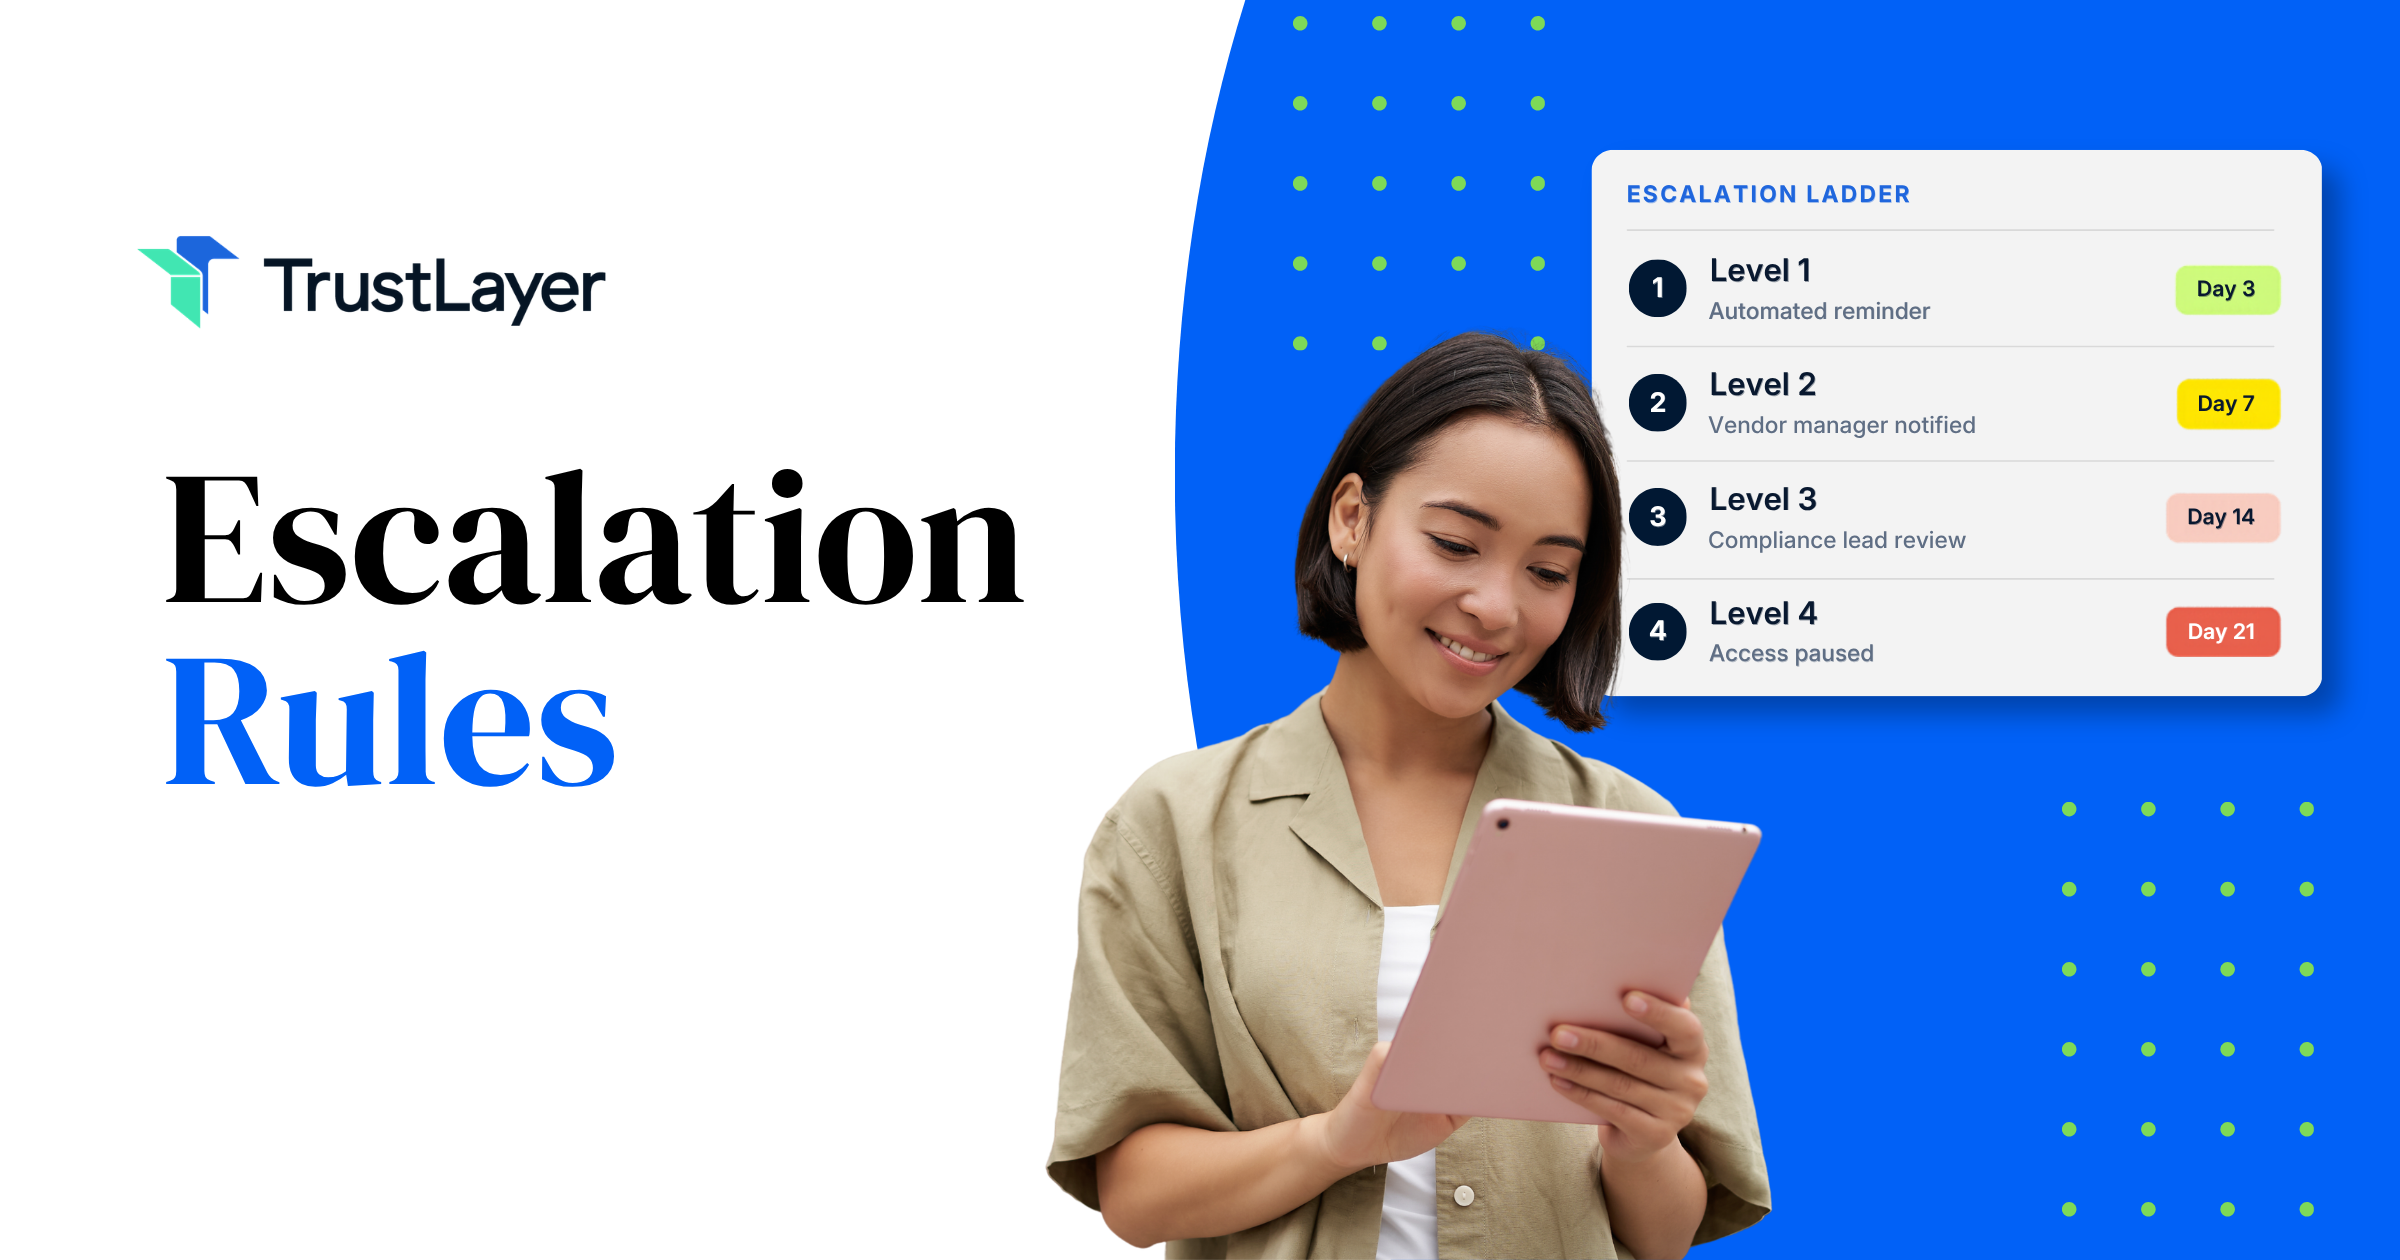
Set target windows by risk level, and escalate automatically when they're exceeded. A tiered approach might look like this:
- High-risk vendors: escalate to the project lead after a few days, and suspend site access if unresolved.
- Medium-risk vendors: escalate after a week, with a hold on new purchase orders.
- Low-risk vendors: routine reminders, with review at the next renewal cycle.
The exact windows depend on your contracts and risk appetite. What matters is that the windows exist and someone enforces them.
Financial Impact and Cost-Avoidance KPIs
Executives fund what they understand, and they understand money. If your compliance metrics never touch dollars, you'll struggle to win budget or attention. Financial KPIs connect your team's work to business impact.
Start with claims transferred versus claims retained. When a vendor causes a loss, does the claim go to their insurer as intended, or does it land on your policy? Every claim that should have transferred but didn't reflects a failure in your compliance program and shows up in your loss history and future premiums.
Other financial measures worth tracking:
- Uninsured exposure value: the total contract value of work performed by vendors with unverified or deficient coverage at any given time.
- Administrative cost per vendor: staff hours spent on collection, review, and follow-up, multiplied by loaded labor cost.
- Premium impact: changes in your own insurance costs tied to loss experience from vendor-related claims.
- Cost of delayed projects: time lost when work stalls waiting for compliance documentation.
Cost avoidance is trickier because you're measuring something that didn't happen. Be honest about that. Rather than inflating hypothetical savings, show the exposure you closed: "We reduced uninsured contract value on active projects by this amount over the quarter." That's credible, specific, and ties directly to program effectiveness. Overstated savings claims erode trust fast, and a skeptical CFO will spot them.
Building a Compliance Dashboard for Executive Stakeholders
A strong leadership dashboard answers three questions in under a minute: Are we exposed? Is it getting better or worse? Where should we act? Anything that doesn't serve those questions belongs in an operational report, not the executive view.
The best dashboards also change how an organization thinks. Instead of compliance being reported quarterly, people can check it whenever they want. That shift from periodic reporting to continuous awareness is the real payoff. Nobody should need to commission a special report to learn whether the company's largest contractor is covered.
Reporting Trends vs. Point-in-Time Data
A snapshot tells you where you stand today. A trend tells you where you're heading, and executives care more about direction than position. A moderately high verification rate that has slipped for three straight months is more alarming than a lower rate that's climbing steadily.
Present your key KPIs as rolling trends over at least six to twelve months. Pair each trend with a short annotation explaining notable shifts, such as a major project kickoff that added dozens of new vendors. Point-in-time data still has a place, especially for "right now" exposure, but it shouldn't be the whole story. Snapshot-only reporting leaves organizations surprised by problems building in plain sight.
Segmenting Risk by Project and Vendor Tier
Blended averages lie by omission. A company-wide compliance rate can look reassuring while a single high-stakes project carries serious exposure. Segmentation fixes that.
Break your dashboard down along two axes. By project or location, so leadership can see which sites are slipping and which managers need support. Add a vendor-tier axis so high-risk trades get scrutiny proportional to their potential for loss. A simple tier structure might separate vendors performing hazardous on-site work, those with limited site presence, and those providing remote or low-risk services.
When a segment goes red, the dashboard should make the owner obvious. That's the whole point: turning visibility into accountability.
Leveraging Automation to Improve KPI Accuracy
Every metric in this guide depends on clean, current data. Manual processes rarely deliver that. When certificates live in email folders and expiration dates sit in a spreadsheet someone updates "when they get a chance," your KPIs become estimates at best and fiction at worst.
Automation earns its place by reducing three specific problems. First, data entry errors: the transposed date or missed endorsement that slips past a tired reviewer. Second, lag, the gap between when something changes and when your records reflect it. Third, inconsistency, where different team members interpret requirements differently, and your accuracy metrics measure reviewer variation rather than vendor compliance.
But automation isn't magic, and I'd caution against buying tools before you fix the structure. If your requirements are inconsistent across contracts, automating them just speeds up the inconsistency. If project teams still onboard vendors outside the system, automation can't track what it never sees. Get the foundations right first:
- Standardize insurance requirements by vendor tier
- Define a single intake point for every new vendor
- Assign clear ownership for remediation at the project level
- Agree on escalation thresholds before you automate them
With that groundwork in place, automation turns compliance from a recurring fire drill into a sustainable practice. Your team spends less time chasing paperwork and more time on judgment calls that actually need a human.
Optimizing Your Risk Strategy with TrustLayer Experts
A useful compliance KPI framework comes down to a few disciplined choices. Measure verification and COI accuracy honestly. Track how fast you close gaps, not just how many you find. Translate exposure into dollars leadership can weigh. Build dashboards that show trends and segments, not flattering averages. And put structure in place before expecting automation to rescue a messy process.
The organizations that get this right stop performing compliance for auditors and start knowing their status every day. That's the difference between metrics as paperwork and metrics that drive action.
If you're ready to build the structural foundation that makes intelligent automation and smarter risk management possible, TrustLayer was built for exactly this kind of modern risk work. Set up a time to talk with our team and get a straight assessment of where your program stands. While you're there, browse other TrustLayer articles for practical guidance on vendor compliance and certificate management.
You might also like